
Project-eTrain
Project Brief
- Description: Energy saving data transmission system, which works by managing heartbeat and data packets
- Conference: IEEE ICDCS 2015, Ohio, Columbus
- Atrributions: The first to prove the feasibility and efficiency of managing heartbeat packets, and the effect was remarkable.
- Relating Techniques: TCP data packets, Android Framework Layer, Power State in RRC(Radio Resource Control), Android Broadcast component.
Demo Video:
Background:
- Global rapid development of mobile devices, both in quantity and capability, makes smartphones ubiquitous in our life. Under this circumstance, smartphones become increasingly important for people’s daily life
- On the other hand, diverse mobile applications on mobile phone support real-time communication services(e.g., WhatsApp, Facebook, WeChat), these applications consume more and more energy, make battery life shorter and shorter
Process
1.(Problem Locating) Where does our battery gone?
After monitoring on energy consumption, we found the energy consumption distribution for a daily use of smartphone like this:
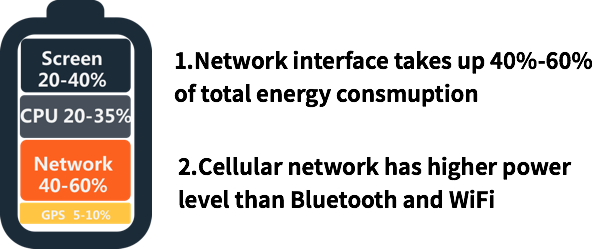
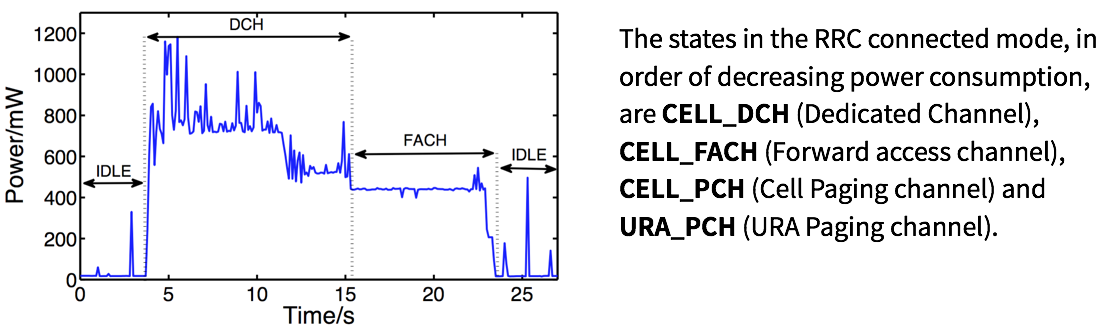
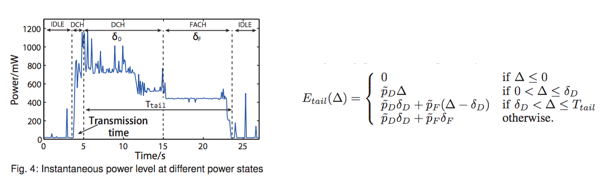
From the distribution we found that Network interface took up large part of total energy. And most of “Network Energy” was consumed by Cellular network. Under close inspection, we found “Tail energy” phenomenon in network transmission. After data transmission, the network interface in cellphone would linger in high power state for about 10 seconds. Energy consumption in this period was called “Tail energy”, which took large part in network energy.
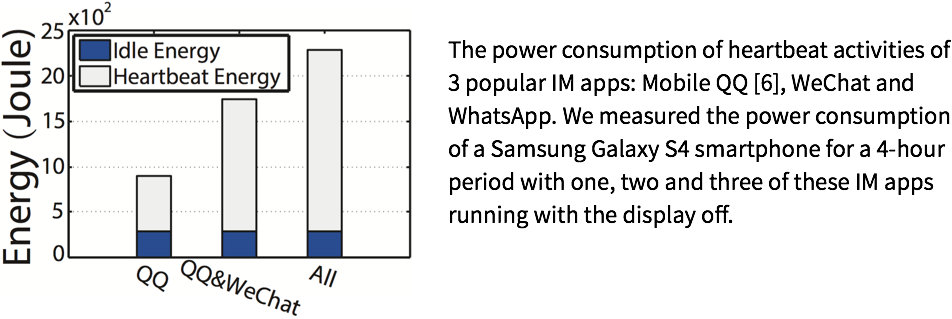
In order to figure out the cause of “Tail energy” in smartphone, we conducted a measurement on smartphone and found that power consumption on heartbeat transmission, a mechanism for instant message applications to keep in touch with servers, was the major cause of energy consumption( takes up about 87% of total transmission energy).
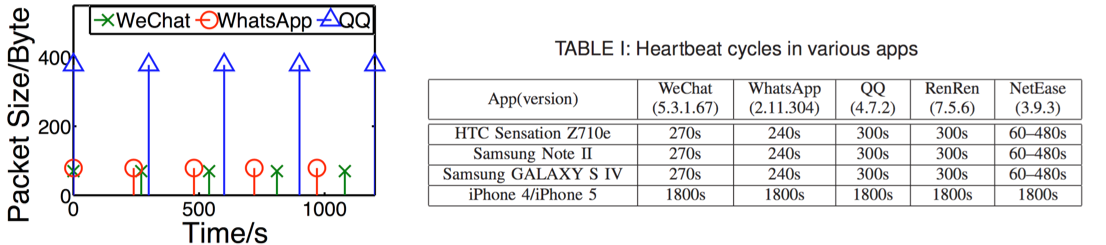
Besides that, heartbeat transmission periods for different applications were different, thus transmission happened randomly and “tail time” distribute randomly. In order to reduce “tail time”, we manage different heartbeat and data transmissions.
2.(Models Formulation) How to manage packets?
Firstly, we identify the tail energy for each package as follow:
(Denote pI, pD, and pF as power levels of the IDLE, DCH and FACH states)
Secondly, there would be delay for data packets if we manage their transmission. And for different data packets, there were different extent of tolerance for delay. Then, we can formulate delay cost model as follow:
(suppose a packet u arrives at time ta(u), then the additional delay incurred is delay = ts(u) − ta(u). Size(u) denotes the size of packet u, B(u) denotes the average bandwidth received by u and tl(u) = size(u)/B(u) is the corresponding transmission time. Weighting coefficient wi reflects the user’s preference on the application i that generates u. The profile function fi(delay) characterizes how the performance degrades with the increase of delay.)

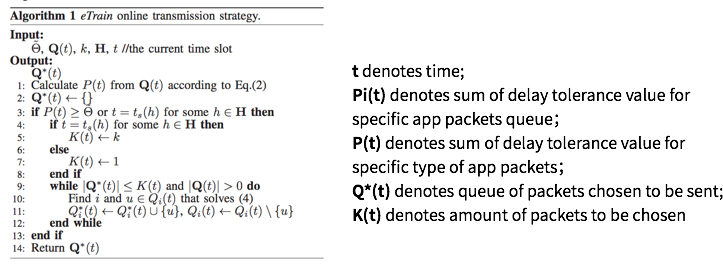
Thirdly, a efficient management calls for a proper strategy. Taking tolerance, packet size, transmission efficiency, user experience into account, we devised transmission strategy as follow(sure, there was a long and tough procedure before we devised this strategy):
3. System Implementation
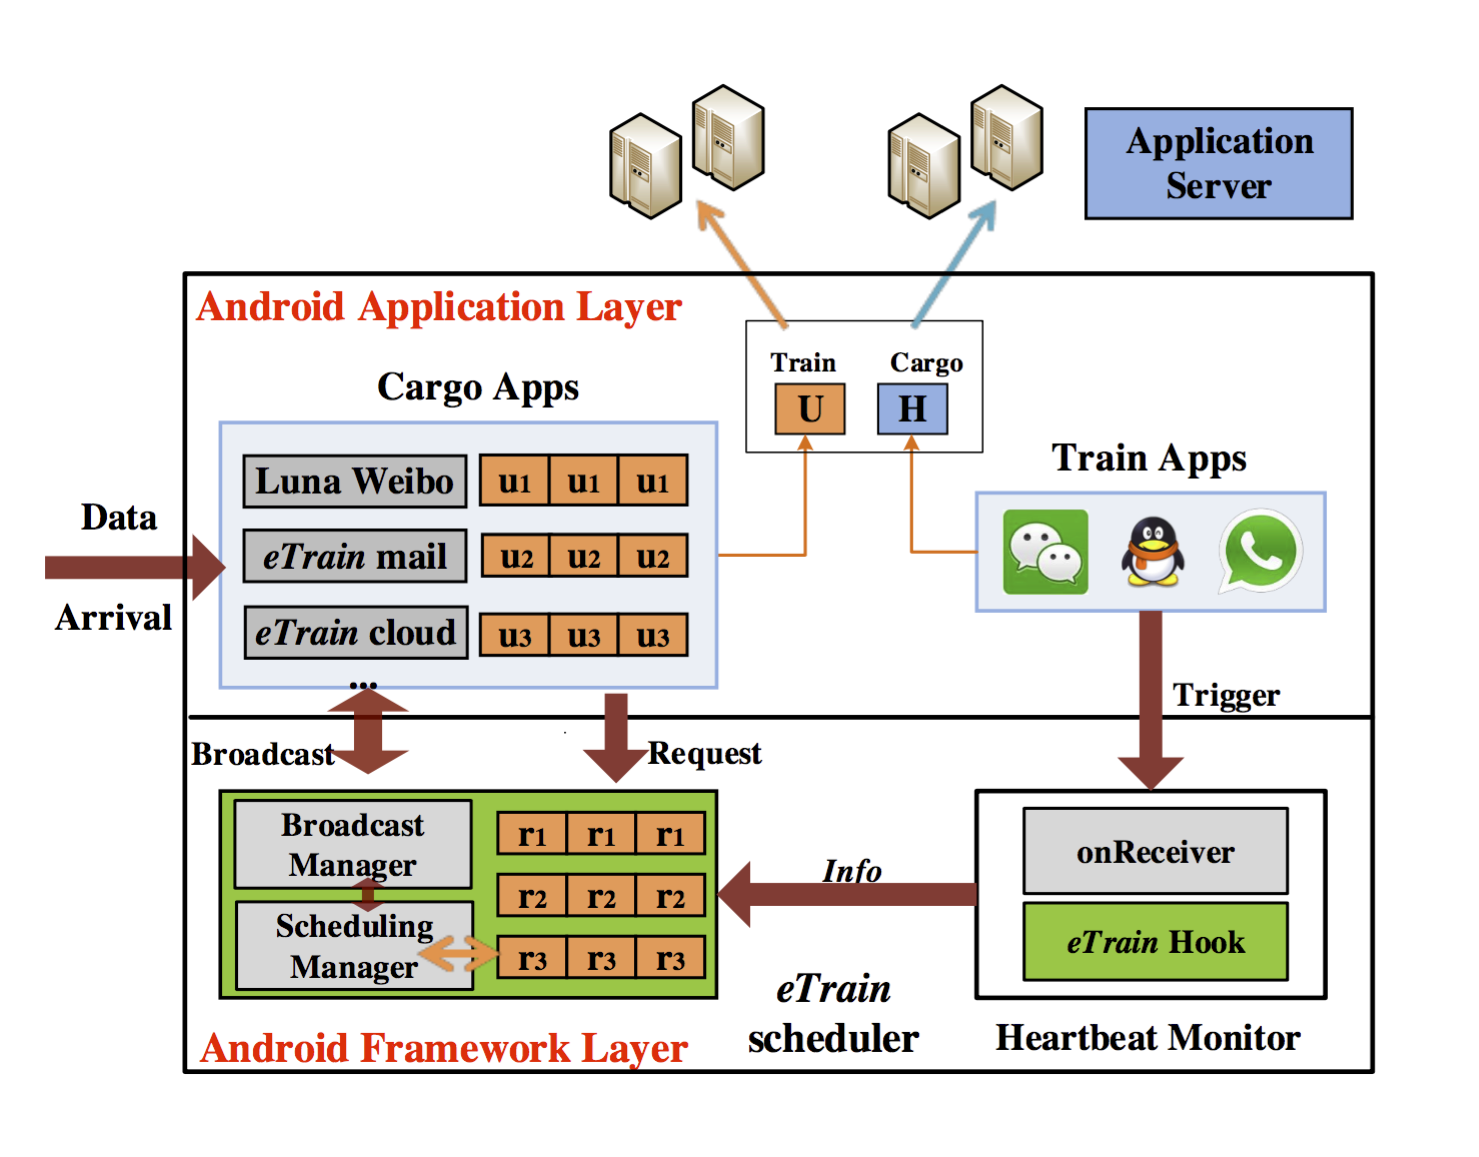
Our transmission management system consisted of three components: Heartbeat Monitor, eTrain Scheduler and eTrain Broadcast
- Heartbeat Monitor was responsible for monitoring heartbeat behaviors of each application and inform other components if there was a heartbeat behavior.
- eTrain Scheduler was responsible for storage, delay and transmission of data packets. After some calculation, this component will chose specific data packets from waiting queue and send them.
- eTrain Broadcast component was the connection between Heartbeat Monitor and eTrain Scheduler. Because heartbeat monitoring and data scheduling behaviors happen in different system process, there should be a system-level communication between these components.
4.Evaluation
Taking real world usage into account, we recorded user behaviors in three major application, email, Weibo(Chinese Twitter), and cloud storage app. The real world trace took place in cellular networks, 2-hours in campus.
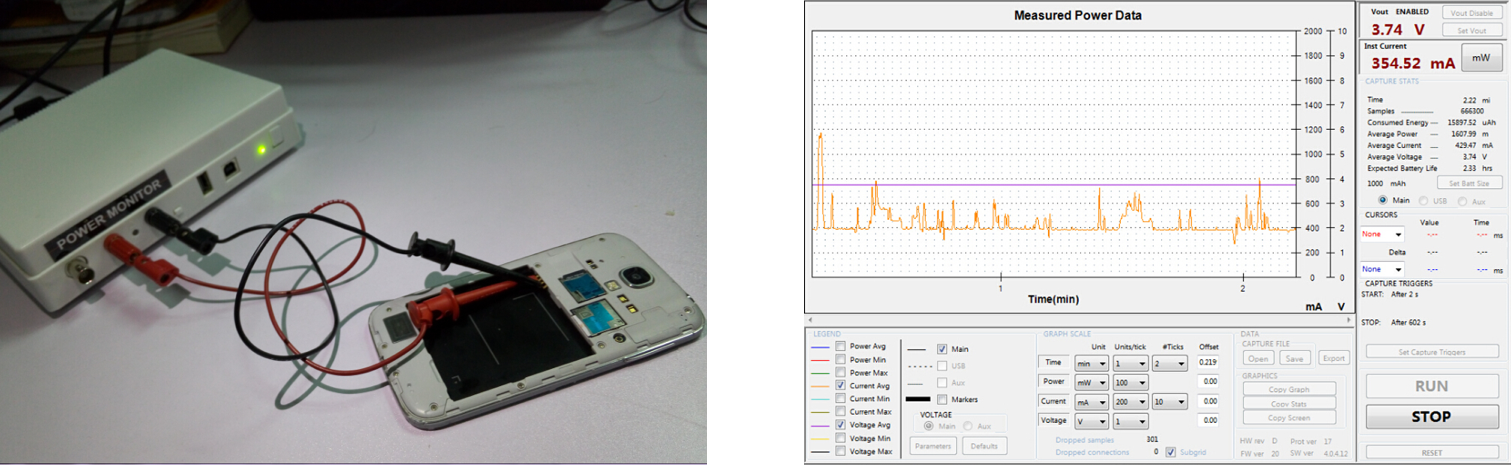
Then, we synthesized similar data packets in laboratory and simulate previous user behaviors on a same smartphone, which was monitored by power monitor.
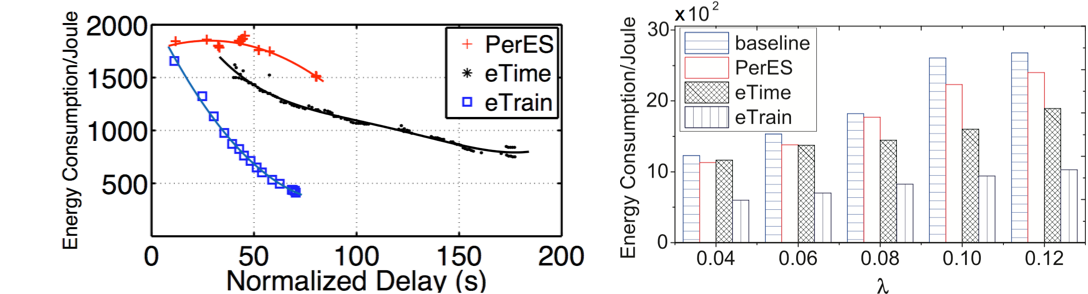
In order to make convincing comparison, we chose two relating models, PerES, eTime, as reference.
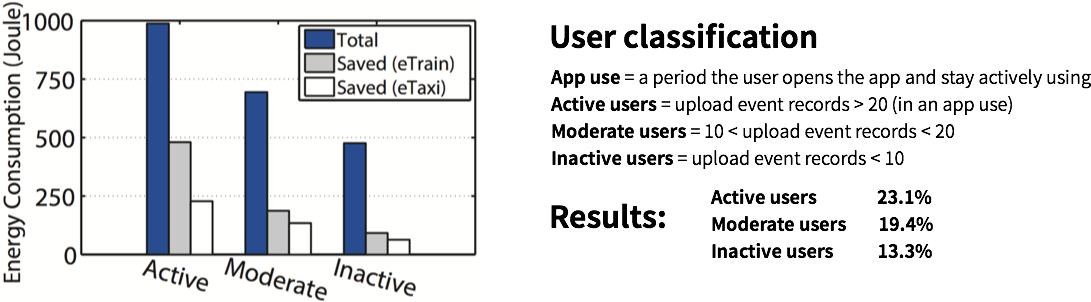
Results were as follow, our system could save 12%-30% of total energy. The efficiency depended on delay of data packets.
Relating Information
Experimental setup
For users who use mobile for different period of time, the energy saving effect would also diverse. More active the user, more obvious the effect.
Contribution
We were the first to prove the feasibility and efficiency of managing heartbeat packets, and the effect was remarkable. More surprisingly, same mechanism was used in Project Doze of Android system by Google.